I am a Labview programmer and I do not like very much the appearance of its polar plots. I would like to know how I can run a Labview application and the graphs get the appearance of Dplot graphs. I own a license of Dplot version 2.3.0.1.
Thanks.
How show graphs in Labview with the Dplot appearance?
Moderator: DPlotAdmin
-
DPlotAdmin

- Posts: 2312
- Joined: Tue Jun 24, 2003 9:34 pm
- Location: Vicksburg, Mississippi
- Contact:
Sorry, but I don't know a thing about Labview. If it gives you the ability to call functions in external DLLs then you might be able to use the functions in DPLOTLIB.DLL with a minimum of fuss (after the initial setup). Otherwise you may be stuck with copy/paste.
I'm hopeful another Labview user will chime in here...
I'm hopeful another Labview user will chime in here...
Visualize Your Data
support@dplot.com
support@dplot.com
call dplotlib from labview
labview has a tool to make this easier. Tools->ImportShared Libaray. This tool requires a c or c++ header (thing.h) to be specified in order to produce the goods.
Otherwise, one can apparently use a "call libarary function node" to do it. The thing.h route would appear to be nicer.
Any chance of the required dplotlib.h?
ref: http://digital.ni.com/public.nsf/allkb/ ... 1E00797C33
Otherwise, one can apparently use a "call libarary function node" to do it. The thing.h route would appear to be nicer.
Any chance of the required dplotlib.h?
ref: http://digital.ni.com/public.nsf/allkb/ ... 1E00797C33
-
DPlotAdmin
- Posts: 2312
- Joined: Tue Jun 24, 2003 9:34 pm
- Location: Vicksburg, Mississippi
- Contact:
The dplot.h header file used in the C examples is probably the best starting point. If you haven't installed DPlot Jr, get it from http://www.dplot.com/dplotjr_setup.exe . After installing, the C header file will be in [dplot jr destination folder]\DPlotLib\C.
Visualize Your Data
support@dplot.com
support@dplot.com
labview library from dll
In fact, if one has a little patience (I went to lunch), labview does its work and produces an lvlib with the required functions in it as VIs, except a few of the bitmap ones (further work). Dragging D plot Plot.vi onto a diagram and doing a "create constant" on the terminal for the Dplot structure produces a cluster constant with 914 elements in it- 99 slots for NP values, 99 slots for linetype values... etc.
So, a bit funny looking but I think it will work
So, a bit funny looking but I think it will work
this is cool.
I am using the "Import Shared Library" function in LabVIEW right now to create a vi. It's taking a while (it shows it to be about half-way complete, and the CPU is cranking...)
So, it eventually finishes what it is doing?
Basically, I want my LabVIEW data acquisition program to automatically create DPLOT files instead of me opening up the data file by hand in DPLOT every time.
I think this will help me do it..... DPlot and LabVIEW seem like they would be two peas in a pod....
It worked for almost all the functions except the bitmap functions mentioned above, and 3 functions I think I need. I got the following error report:
How did you get around this problem?Parsing header file warnings:
No errors/warnings occurred when parsing the header file.
The following errors/warnings occurred when generating the wrapper VIs for this shared library.
Cannot create VI
The following VI cannot be created. This might indicate that the associated function contains parameters of a data type that cannot be converted directly. To work around this issue, you can create a custom control or typedef control to represent a complex structure or multidimensional array, then re-run the Import Shared Library wizard and select Update VIs from a shared library. Using the same shared library, step through the wizard again. On the Configure VIs and Controls page, assign the custom control or typedef to the associated parameter(s). Complex structures include nested structures, structures containing arrays, arrays of strings, and multidimensional arrays.
D Plot Plot.vi
D Plot Plot8.vi
D Plot Plot8p.vi
-
DPlotAdmin
- Posts: 2312
- Joined: Tue Jun 24, 2003 9:34 pm
- Location: Vicksburg, Mississippi
- Contact:
You're doing great. Keep it up! 
Sorry, I have no idea - I've never had LabView. If the tsunami didn't wash away our Aussie friend maybe he'll chime in here.
Sorry, I have no idea - I've never had LabView. If the tsunami didn't wash away our Aussie friend maybe he'll chime in here.
Visualize Your Data
support@dplot.com
support@dplot.com
I think that by "custom control" LabVIEW wants me to create a little box that takes inputs for each of the variables in those functions.
So, for example, in the Plot() function, there's a cluster called "DPlot" and it looks like it has the following variables:
Version
hwnd
DataFormat
MaxCurves
and so on, and so on....
Those variables are "unsigned long" types, etc.
But then, further down, when you get to variables in that function like "NP" and "LineType," they say they are the data type of "unsigned long[100]"
What's the [100] for? Does it think it is an array or something? I think that's what is making LabVIEW choke when it tries to convert the "struct" datatype containing all these things to a "cluster," because it sees "unsigned long[100]" and says "what the hell is [100]?"
-
DPlotAdmin
- Posts: 2312
- Joined: Tue Jun 24, 2003 9:34 pm
- Location: Vicksburg, Mississippi
- Contact:
Those are arrays, and 100 is the correct size. (You can have up to 100 curves; NP[0] is the number of points in the first curve, NP[1] is the number of points in the second curve, etc.)
But what that means to getting this working in LabView I have no clue about.
But what that means to getting this working in LabView I have no clue about.
Visualize Your Data
support@dplot.com
support@dplot.com
yeah, that makes sense. LabVIEW apparently is not able to convert a datatype directly if it's something like a structure with nested arrays.
So, those 3 functions that need arrays within the structures have undefined structures.
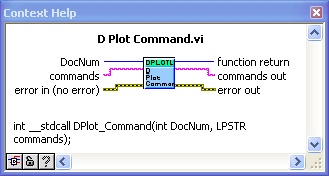
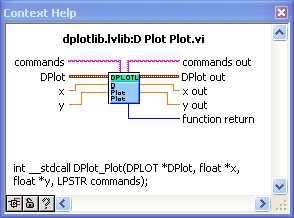
Here is the Plot() function:

"DPlot" and DPlot out" are now custom controls, but I need to make them have all their data. (they need Version, hwnd, DataFormat, but they also need the NP array, etc).
Once I figure out how to do that, it should be okay. maybe.....
So, those 3 functions that need arrays within the structures have undefined structures.
Here is the Plot() function:
"DPlot" and DPlot out" are now custom controls, but I need to make them have all their data. (they need Version, hwnd, DataFormat, but they also need the NP array, etc).
Once I figure out how to do that, it should be okay. maybe.....
-
DPlotAdmin
- Posts: 2312
- Joined: Tue Jun 24, 2003 9:34 pm
- Location: Vicksburg, Mississippi
- Contact:
This is way outside anything I can even comment on, sorry. I'm hopeful AWaterman will shed some light on this.
Visualize Your Data
support@dplot.com
support@dplot.com
Re: labview library from dll
AWaterman,AWaterman wrote:In fact, if one has a little patience (I went to lunch), labview does its work and produces an lvlib with the required functions in it as VIs, except a few of the bitmap ones (further work). Dragging D plot Plot.vi onto a diagram and doing a "create constant" on the terminal for the Dplot structure produces a cluster constant with 914 elements in it- 99 slots for NP values, 99 slots for linetype values... etc.
So, a bit funny looking but I think it will work
You say here that you were able to use the D plot vi, that has the DPlot structure, but in order to even get the D plot vi made, I had to convert it to use a custom control during conversion.
How did you get it to make the vi?
Oh.............. did you just let it make it, got the error, and then passed it the constant it needed? If so, awesome.
yeah, see, I'm trying to create a custom control for the Dplot structure....
do I need to create 100 NP unsigned longs?
like,
NP[0]
NP[1]
.
.
.
NP[99]?
Because that's what LabVIEW does when it wants to put an array that was in a structure in C into a cluster. it puts each element into the structure individually.
Still playing with it....
do I need to create 100 NP unsigned longs?
like,
NP[0]
NP[1]
.
.
.
NP[99]?
Because that's what LabVIEW does when it wants to put an array that was in a structure in C into a cluster. it puts each element into the structure individually.
Still playing with it....
In spite of the best effortd of mother nature, we are still high and dry in Canberra (1800 feet elevation). I do feel for those poor folk in Japan at the moment.
How do you get a diagram into these posts? I wanted to do that and couldn't see how you do it. A picture is worth a 1000 words
I'll review what I did and try and respond to Idriss's stuff. I suspect that using the "create constant" option when mousing over a terminal may be the trick
How do you get a diagram into these posts? I wanted to do that and couldn't see how you do it. A picture is worth a 1000 words
I'll review what I did and try and respond to Idriss's stuff. I suspect that using the "create constant" option when mousing over a terminal may be the trick
-
DPlotAdmin
- Posts: 2312
- Joined: Tue Jun 24, 2003 9:34 pm
- Location: Vicksburg, Mississippi
- Contact:
Les,
You can only post links to images, not the images themselves. If you don't have an FTP/http site where you can post, send the image(s) to me and I'll make them available.
You can only post links to images, not the images themselves. If you don't have an FTP/http site where you can post, send the image(s) to me and I'll make them available.
Visualize Your Data
support@dplot.com
support@dplot.com
I ended up creating a cluster for that function, and passing it to the dplot DLL file using a "Call Library" function node.AWaterman wrote:In spite of the best effortd of mother nature, we are still high and dry in Canberra (1800 feet elevation). I do feel for those poor folk in Japan at the moment.
How do you get a diagram into these posts? I wanted to do that and couldn't see how you do it. A picture is worth a 1000 words
I'll review what I did and try and respond to Idriss's stuff. I suspect that using the "create constant" option when mousing over a terminal may be the trick
The best I got Friday night/ Monday morning was that LabVIEW opened DPlot junior (not sure why it wouldn't open the full version) but I couldn't get anything plotted for some reason.
Using the "create constant" option doesn't work if you can't define the function. Remember, the "wizard" will not work, because it doesn't understand how to parse the .H file with regard to C++ (or C) "structures" that have arrays of characters and stuff like that inside them. Complex structure to cluster conversion makes LabVIEW cry to its mama.
So I'm stumped for now. I'll try to post the cluster I created for the function later.... I don't have time this second. I really do appreciate the help.
Maybe your version of Labview let the wizard work where mine did not. If yours works, and you still have the VI file for that function, it should work everywhere, right?
-
DPlotAdmin
- Posts: 2312
- Joined: Tue Jun 24, 2003 9:34 pm
- Location: Vicksburg, Mississippi
- Contact:
Again, I know nothing about LabView. But all of the functions in DPLOTLIB.DLL call the same internal routine when picking out which application to launch: If the full version is installed (meaning there's a registry entry at HKEY_CURRENT_USER\Software\DPLOT\shell\open\command or that dplot.exe is already running), it will pick the full version.The best I got Friday night/ Monday morning was that LabVIEW opened DPlot junior (not sure why it wouldn't open the full version)
The only time this isn't true is if you've specified a minimum version and dplotjr.exe meets that requirement, while dplot.exe does not.
Nothing especially enlightening here, but the next time you try, you might want to first launch dplot.exe. If it still doesn't bring the full version to the foreground then there is definitely something amiss.
Visualize Your Data
support@dplot.com
support@dplot.com
-
DPlotAdmin
- Posts: 2312
- Joined: Tue Jun 24, 2003 9:34 pm
- Location: Vicksburg, Mississippi
- Contact:
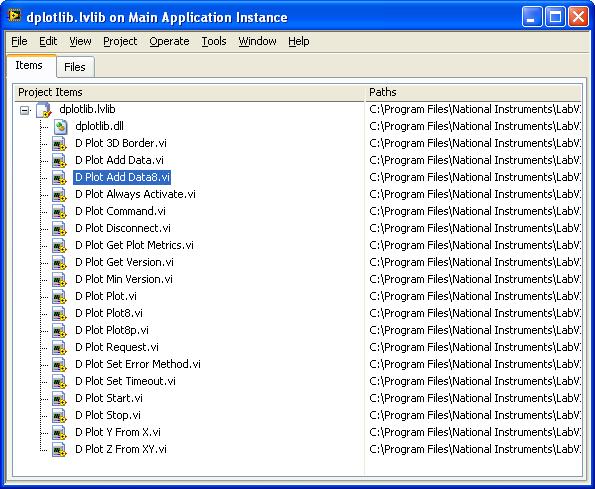

My labview (8.5) DID succeed in making Dplotlib labview library, and it issued the report at the end as follows
"Your generated files are installed in the following folder:
C:\Program Files\National Instruments\LabVIEW 8.5\user.lib\dplotlibx
Parsing header file warnings:
No errors/warnings occurred when parsing the header file.
No errors/warnings occurred when generating the wrapper VIs for this shared library."
The lib contains VIs as shown in the graphic list (David to display). I placed Dplot plot .vi and Dplot command.vi on the diagram and was then able to create the constant as a previoulsy described.
My library is called dplotlibx because it was my second attempt. I assumed it was not working when it took ages to create, and so I aborted the first. The secret was to go and have lunch while labview made the library.
Note that I have not gone the whole way and actually plottoed anything. I had (and have) other priorities so stopped once I had the vis appearing OK
-
DPlotAdmin
- Posts: 2312
- Joined: Tue Jun 24, 2003 9:34 pm
- Location: Vicksburg, Mississippi
- Contact:
Two more images from AWaterman (unfortunately it is still Greek to me):
Visualize Your Data
support@dplot.com
support@dplot.com
-
DPlotAdmin
- Posts: 2312
- Joined: Tue Jun 24, 2003 9:34 pm
- Location: Vicksburg, Mississippi
- Contact:
Your e-mail address stored in the forums appears to be legit, so he already has that. In any case thanks very much for your input, and I'm glad you weren't washed away.
If I start making a lot more with DPlot then I'll be able to justify paying for LabView... so talk it up among your associates
If I start making a lot more with DPlot then I'll be able to justify paying for LabView... so talk it up among your associates
Visualize Your Data
support@dplot.com
support@dplot.com
I realize this is a fairly old thread now, but did anyone get this to work to the point where you could pass data from LabVIEW?
I've created a D Plot Plot.vi and I am able to get DPlot Jr to open. If I run my vi a second time, axes and gridlines show up, but no data. I can provoke it to return a value of -3 or -4 by changing the Version and DataFormat, otherwise it always returns 0.
I noticed that AWaterman's DPlot cluster is brown, indicating that it is numerics only. Shouldn't this cluster also include the Legend, Label, Title, XAxis, and YAxis strings?
I figured it out. For future reference, to convert a LabVIEW DPlot cluster into the DPlot struct you need to:
1) Unbundle the cluster
2) Convert the NP, LineType, and SymbolType arrays to clusters using "Array To Cluster". HINT: Right Click "Array To Cluster" to change the cluster size to the size DPlot is expecting (whatever MAXC is for your version).
3a) Convert each string in the Legend, Label, and Title arrays to a byte array with "String to Byte Array".
3b) Convert each byte array to a cluster, making sure to set the correct size.
3c) Create an array of these clusters, then convert those arrays to clusters. Legend, Label, and Title end up as clusters of clusters of bytes.
4) Convert the XAxis and YAxis strings to byte arrays and convert the byte arrays to clusters.
5) Bundle everything in the correct order and pass it to the Call Library Function for DPlot_Plot. The input parameter should be set to "Adapt to Type" with a data format of "Pointers to Handles".
You probably don't want to look at the final cluster. It's huge and caused LabVIEW to lock up for a few minutes while it figured out how to draw it.