Plotting GPS co-ordinates
Posted: Wed Oct 24, 2007 9:46 pm
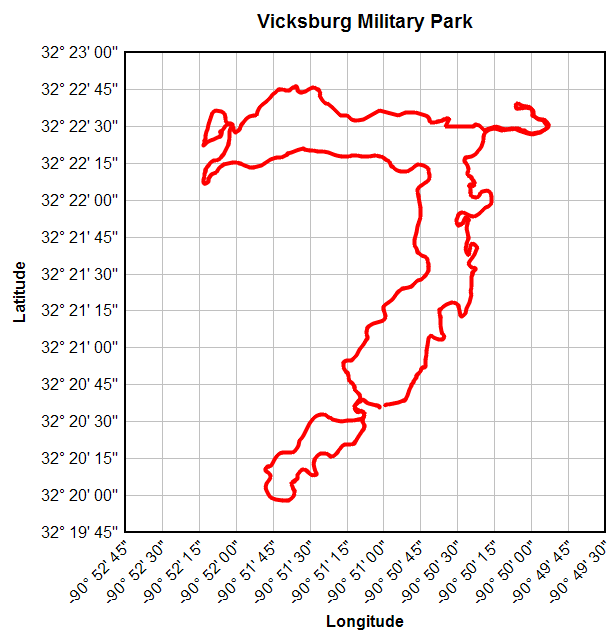
I can save data from my Garmin GPS unit in gpx format. One of the fields is a position co-ordinate in OS grid ref format (UK) [changed from LAT/LONG]
e.g.
NG 40909 20619
NG 40910 20621
NG 40909 20620
I would like to plot these co-ordinates as eastings v northings i.e.
X=40909 Y=20619
X=40910 Y=20621 etc
Is there any way DPlot can take the grid ref format and split it automatically so that it produces an XY plot ??
e.g.
NG 40909 20619
NG 40910 20621
NG 40909 20620
I would like to plot these co-ordinates as eastings v northings i.e.
X=40909 Y=20619
X=40910 Y=20621 etc
Is there any way DPlot can take the grid ref format and split it automatically so that it produces an XY plot ??