New undocumented features in version 1.98
Posted: Mon Jan 17, 2005 12:56 am
Along with the changes shown on the Revision History page, version 1.98 includes a couple of new, incomplete and undocumented features that will at this point primarily be of interest to programmers:
- Point labels for surface plots. These may currently only be added via the new TextPointLabel3D command via a macro or a call to DPlot_Command in DPLOTLIB.DLL, and cannot be edited inside DPlot other than with the right-click menu options (and "Edit" does nothing). These labels are only drawn on 2D representations of the plot, labels for 3D views may... or may not... happen in a subsequent release. Syntax for TextPointLabel3D is:
Edit: Whoops, The original posting neglected to include the DataSet parameter in the TextPointLabel3D syntax. Sorry for any confusion.
[TextPointLabel3D(DataSet,Xdata,Ydata,Xloc,Yloc,Frame,Opaque,|Flags,|"Label")]
where
DataSet specifies which surface or set of points the label is applied to. Currently this value is not used, but may be used in a future version if point label support for 3D scatter plots is added and/or if support for multiple surfaces is added.
XData, YData are the X and Y coordinates of the data point to label. These do not need to be exact; DPlot will find the data point closest to these values.
Xloc,Yloc are the X and Y coordinates of the label, in data space, subject to Flags.
Frame - if non-zero a box will be drawn around the label.
Opaque - if non-zero the label will obscure the background, background of the label will be white.
Flags - Optional combination of
2 - label the point with the maximum Z value. XData and Ydata are ignored.
4 - same as 2, but for the minimum Z. 2 and 4 are of course mutually exclusive.
16 - Rotate label 90 degrees.
32 - Xloc, Yloc specify offsets from the labeled point in inches rather than absolute position in data space.
64 - Label is mouse-activated; it will be invisible until/unless the user moves the mouse cursor over the labeled point.
"Label" is the text of the label. As with XY plots, $X, $Y, and $Z will be replaced with the X, Y, or Z coordinates of the point. - You can now specify endpoints of line segments that form the border of a surface plot. Normally, DPlot generates a convex mesh of triangles from your input 3D points. While this is often appropriate, there are of course cases where it is not. Currently the only way to specify the border is by use of the new DPlot_3DBorder function in DPLOTLIB.DLL or by editing a saved DPlot file with a text editor. DPlot_3DBorder is illustrated in the ctest DPLOTLIB example program. The demo actually demonstrates specifying a hole in the surface rather than a concave exterior border, but the procedure is the same. Syntax for DPlot_3DBorder is:
DPlot_3DBorder(int DocNum,int NumPoints, double *Points)
where
DocNum is the document index returned by DPlot_Plot and similar functions.
NumPoints is the number of points defining the border.
Points is an array of double-precision X and Y values that specify the endpoints of the border, in counterclockwise order. Order in memory should be x1,y1,x2,y2,...
DPlot checks to see whether the center of each generated triangle is inside the border and deletes the triangle if it is not. So... keep in mind that you might have triangles with one or two points outside the border that will be retained.
Here's a simple example: Copy the following table and Paste Special in DPlot with "3D - X,Y,Z values" checked. The X and Y values are the vertices of a star.
-1.618034, 1.90211308,6.236067772
-1,0,1
-0.618034,1.1755705,1.76393199
-0.381965995,1.90211308,3.76393199
0,0.726543069,0.527864873
0,3.077683449,9.472135544
0.381965995,1.90211308,3.76393199
0.618034,1.1755705,1.76393199
1,0,1
1.618034,1.90211308,6.236067772
We want a star, but we get a pentagon, shown here with triangle borders turned on:
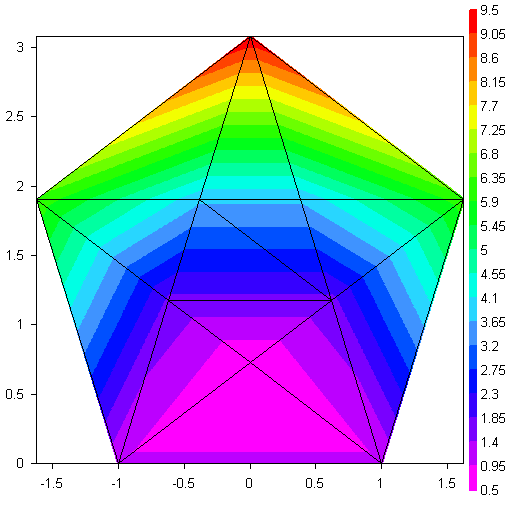
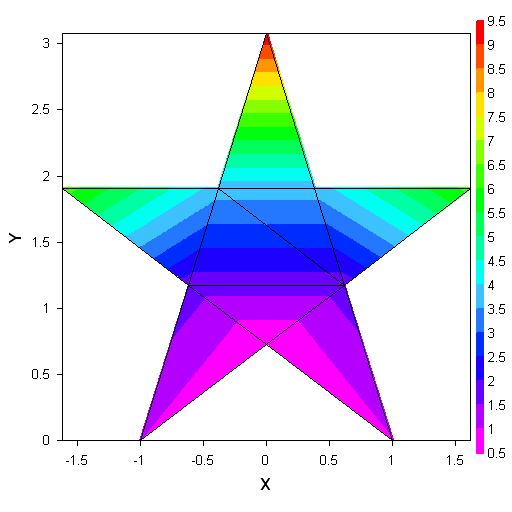
We get a pentagon because DPlot will always generate a convex mesh - there's not enough information in a simple list of points to determine what the border should be. By passing the 10 X,Y vertices of the star to DPlot via DPlot_3DBorder, OR adding the following to a saved DPlot file:
BorderPoints
10
-1.,0.
0.,0.726543069
1.,0.
0.618034,1.1755705
1.618034,1.90211308
0.381966,1.90211308
0.0,3.077683449
-0.381966,1.90211308
-1.618034,1.90211308
-0.618034,1.1755705
we instead get:
Next version you'll of course be able to specify the border within DPlot, and it is likely the triangle-removal procedure will be refined to handle the troublesome cases you're thinking of right now