Page 2 of 3
2D graph "glitch"
Posted: Tue May 25, 2004 5:03 pm
by guibson
Hi,
I did a 2D graph and the result is with "glitch" like you can see:

If I don't mask DPlot and check the result, it's the same until I maximised the window, the result become clear. I search and try differents solutions but none work well. Is there a solution?
________
HERBALAIRE
Posted: Tue May 25, 2004 5:11 pm
by DPlotAdmin
I'm sorry but I don't see anything wrong with your picture, unless it's that the bottom of the 0.5 and 1 on the X axis are clipped, and I suspect that's an artifact of how you grabbed the screen shot rather than a DPlot problem.
What is it specifically that you don't like about that plot?
2D graph
Posted: Tue May 25, 2004 5:18 pm
by guibson
Look the pink line. The line is not clear and when I maximized DPlot's window, the line besome clear. The problem is that the application receive the line with glitchs.
________
Return Of Premium Life Insurance Forums
Posted: Tue May 25, 2004 5:41 pm
by DPlotAdmin
Try this: Use Notepad to open dplot.ini in the DPlot folder. Move to the end of the file and add these lines:
[Debugging]
UseDPlotClipping=1
save dplot.ini and try your plot again.
"UseDPlotClipping" is a bit of a misnomer. This setting forces DPlot to use software clipping rather than Windows API routines, but it also forces DPlot to use my line-drawing routines rather than the (bah!) faster Windows API routines. With very large data sets your plots will be a bit slower, but you should get results similar to this:
Posted: Tue May 25, 2004 10:10 pm
by DPlotAdmin
By the way, fiddling with that ini setting is only a temporary measure. Your post made me take a closer look at what's going on and the problem is now fixed. The fix will be included in the next release. The problem only crops up with solid lines > 1 pixel wide on plots in which the scaled distance between adjacent data points is less than 1 pixel. That's why you don't see the problem when you maximize the window.
Defaut value for ContourView function
Posted: Wed Apr 06, 2005 3:16 pm
by guibson
What are the default values for this function if it is not used in a command string for a graphic ?
________
Buy Iolite Vaporizer
DPlot_3DBorder function
Posted: Wed Apr 06, 2005 3:19 pm
by guibson
Can I get more information and maybe an example for this function ?
________
Suzuki Boulevard S50
Posted: Wed Apr 06, 2005 3:27 pm
by DPlotAdmin
I don't understand your question. What function? Did you mean to post this somewhere else?
If you're talking about [FilePrint()], that's fully documented in the Help file.
If instead you're talking about "UseDPLOTClipping", that was only a workaround to get rid of jaggies in plots where the points were so closely-spaced that they overlapped on the screen. A drawing optimization for this case ended up fouling up the plot, as shown in your example. This problem was fixed almost a year ago, so this isn't relevant to the current version.
Question about a function
Posted: Wed Apr 06, 2005 4:19 pm
by guibson
The function name was on the subject. So, this is the function I need help : DPlot_3DBorder function
Can you give me an example?
________
Crf150F
Posted: Wed Apr 06, 2005 4:28 pm
by DPlotAdmin
Ah, sorry. I tend to overlook those.
The ctest example uses DPlot_3DBorder; there isn't currently one in VB but it is fairly simple to use. Syntax is described in the documentation:
http://www.dplot.com/lib/dplot_3dborder.htm. The border points should be in order but may be in either direction: clockwise or counterclockwise.
Information for ContourView function
Posted: Thu Apr 07, 2005 7:55 am
by guibson
ContourView function
I'd like to know what are the min. and max. values for the parameters of this function. Also, if not specified in the argument line what are the default values.
Thanks !
________
Mexico City Hotels
Posted: Thu Apr 07, 2005 8:23 am
by DPlotAdmin
Azimuth can be any angle. Elevation should be between -90 and 90, inclusive. Both angles are in degrees. There are no default values; both must be specified.
About the new version and Y axis
Posted: Fri Apr 08, 2005 10:31 am
by guibson
Hi,
I tried the latest version of Dplot and now, my program show the Y axis in the wrong angle. The Title1 also has change. The font point is now bigger than the previous version. Are you able to tell me wich properties have been had or modified?
________
HOTBOX VAPORIZERS
Posted: Fri Apr 08, 2005 10:42 am
by DPlotAdmin
Nothing has changed with regard to the font sizes. If your program is not explicitly setting the font sizes and those sizes are important to you, you need to be doing that with TextFont commands. Otherwise DPlot will get font sizes from the default settings file (if there is one) or from the last time DPlot was run.
There might be weird cases where the Y axis (or the X) is drawn at the wrong angle, but this would not be a recent change. I thought I had all possible orientations covered but it is possible that I missed something. If you'll let me know the view angles, the X, Y, Z scale factors and the X, Y, and Z extents of your plot then I'll look into this.
About the Y axis
Posted: Fri Apr 08, 2005 12:17 pm
by guibson
Here is an image

As you can see the Y axis label "Temperature ?C" should be vertical not in horizontal. My code did not change between the two versions. I don't know how to repair the problem.
________
Ford Lightning
Posted: Fri Apr 08, 2005 12:27 pm
by DPlotAdmin
I assumed we were talking 3D.
What has most likely happened is DPlot has fouled up and wrote all 0's for the font sizes, weights, names, etc. to dplot.ini. This only seems to happen when plotting via DPLOTLIB.DLL. I thought I had this problem beat but must have missed something. Open dplot.ini (in the same folder as DPlot) with Notepad. Find the [Fonts] section, under which there will be 8 lines: "Font1=..." through "Font8=...". If I'm right, then all of those lines will be entirely 0's. If so, just delete the entire section starting with [Fonts] and save the file. If you have a file named default.set in the DPlot folder do the same for it. Now start DPlot standalone and close it. This *should* fix the problem, but let me know if it doesn't.
My previous advice is still valid: if you want to ensure that you get the fonts you want, rather than whatever DPlot wants to use as a default, then you should use a series of TextFont commands in your program.
Font problem
Posted: Fri Apr 08, 2005 12:35 pm
by guibson
I did it and nothing append.
________
Vermont Medical Marijuana Dispensary
Posted: Fri Apr 08, 2005 12:40 pm
by DPlotAdmin
You did what? Were all of those font entries "0,0,0,0,...."? Are they now?
Also check to make sure that DPlot isn't still running hidden, which would have prevented your changes to dplot.ini from doing anything. Start Task Manager with Ctrl+Alt+Del, look at the Processes tab and make sure dplot.exe isn't in there. If it is, click "End Process".
Posted: Fri Apr 08, 2005 12:51 pm
by guibson
Go see this reply completely at the end of the page (
http://www.dplot.com/forums/viewtopic.php?t=5&start=30). you will see an image of the problem.
________
Honda Fc Sport History
Posted: Fri Apr 08, 2005 12:59 pm
by DPlotAdmin
I saw the image and understand the problem: your Y axis label is horizontal rather than vertical.
Please answer my previous questions: what did you do? Did you edit dplot.ini and, if present, default.set? Did you use Task Manager to make sure that DPlot wasn't still running when you made those changes? (assuming that changes were made). Are you using a TextFont command to set the font used by the Y axis? If so, please copy the command and the parameters used to your reply.
Posted: Fri Apr 08, 2005 1:28 pm
by guibson
I edit dplot.ini and erase everything in the [fonts] section. There was no default.set file. No other instance of dplot was in memory. Here is my code to set the fonts :
Code: Select all
cmds = cmds & "[FontPoints(1,8)][FontPoints(2,8)][FontPoints(3,8)][TextFont(2,8,700,0,0,0,0,""arial"")][TextFont(3,8,700,0,0,0,0,""arial"")]"
    cmds = cmds & "[FontPoints(4,10)][FontPoints(5,10)][FontPoints(6,7)]"
________
No2 vaporizer
Posted: Fri Apr 08, 2005 2:06 pm
by DPlotAdmin
Try adding a TextFont command for the Y axis:
[TextFont(5,10,700,0,0,0,0,""Arial"")]"
The lower case "arial" in your example worries me a bit; that seemed to work when I tried it but the font name is correctly "Arial". It's possible that DPlot is fouling up with the lower case version.
Next release I'll add a check against a null facename and set to "Arial" if it's blank; that should fix this problem once and for all.
Posted: Mon Apr 11, 2005 12:42 pm
by guibson
I change arial to Arial and the result is the same. I will downgrade to a previous version fo DPlot and send you information about the results.
thanks
________
No2 vaporizer reviews
Posted: Mon Apr 11, 2005 12:59 pm
by DPlotAdmin
Did you also try this?
Try adding a TextFont command for the Y axis:
[TextFont(5,10,700,0,0,0,0,""Arial"")]"
Posted: Mon Apr 11, 2005 1:21 pm
by guibson
You found the problem! The problem is fixed. Thanks a lot!
________
Honda Odyssey (ATV)
Posted: Mon Apr 11, 2005 1:39 pm
by DPlotAdmin
You're welcome, but that's not really the problem... just a symptom. That step shouldn't be necessary, and won't be in the next version.
About a dot in 3D graph
Posted: Fri Apr 15, 2005 9:57 am
by guibson
I tried to put a dot in a 3D graph. I took the btest7 example and had minors things to ajust. The problem is the lines in Y and Z axes are off. The X axis is perfect. Is it possible that the btest7 example contains constants just for the context?
________
Herbal Health
Posted: Fri Apr 15, 2005 10:17 am
by DPlotAdmin
That's possible, though I don't see any problems. If you'll let me know:
The X,Y, and Z extents of your data
The scale factors used (those returned by DPlot_GetBitmapEx)
The viewing angles you're using
that would be helpful in finding the problem.
Posted: Fri Apr 15, 2005 10:50 am
by guibson
extents(0) = 0.5
extents(1) = 0
extents(2) = 1.25
extents(3) = 15
extents(4) = 1045.96
extents(5) = 1306.52
azimuth : 1.5708
elevation : 1.5708
hll : 51
hur : 398
scale : 23.1333
SIZE : 60
stretch(0) : 20
stretch(1) : 1
stretch(2) : 0.02878
vll : 429
vur : 82
xhi : 25
xlo : 10
yhi : 15
ylo : 1.84321E-15
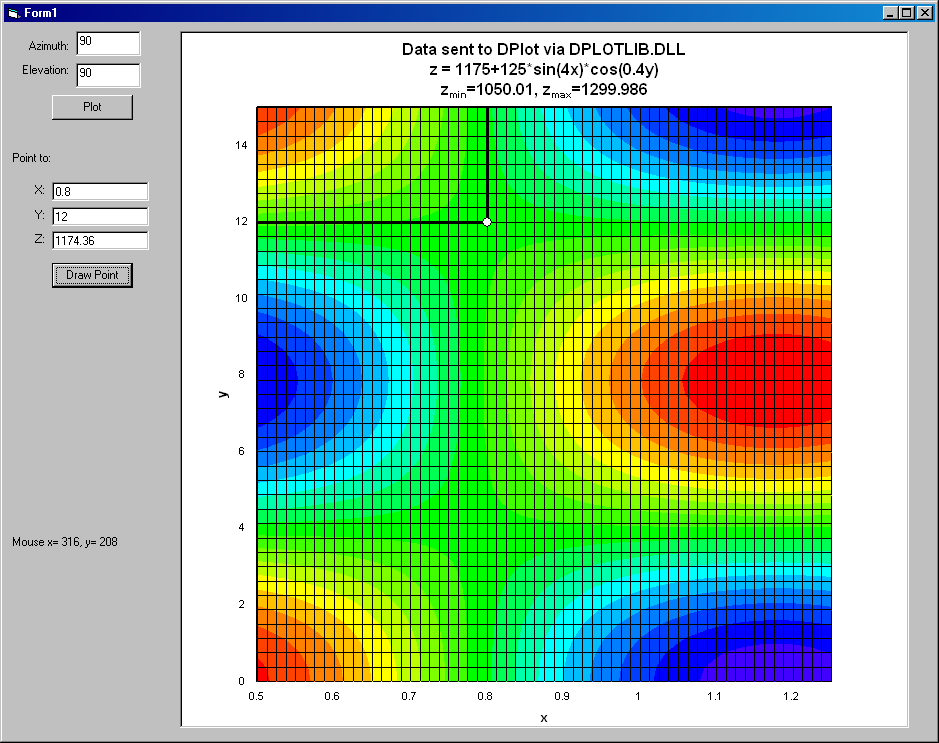
Azimuth 90
Elevation 90
I used these angles for troubleshooting.
thanks
________
Maryjane
Posted: Fri Apr 15, 2005 1:11 pm
by DPlotAdmin
I modified that btest7 program, changing the equation and the extents to match what you're doing (as far as I can tell) and it looks fine to me, other than in the first shot that vertical line from the data point should be hidden, but that's outside the scope of what we're talking about.
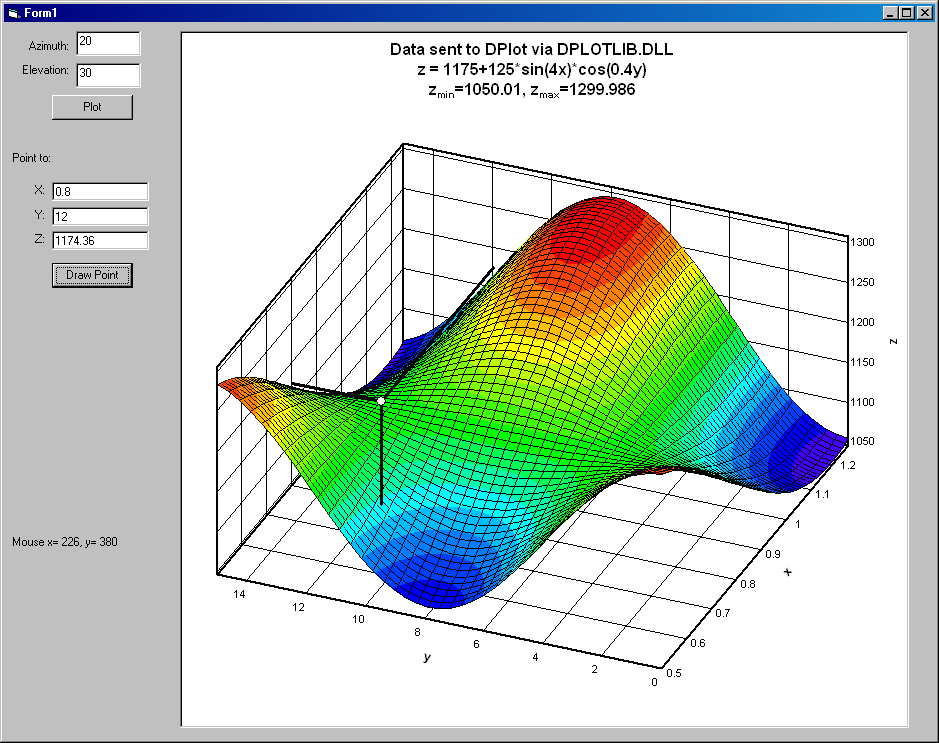
Make sure you're using the ManualScale command to set the extents to the values you want. If you don't do that then at best your line segments will be drawn to the wrong endpoints. Other than that I don't know what might be the problem, but this appears to be working correctly at the DPlot/DPLOTLIB end.