The only difference I can see is the DataFormat of the DPlot type. Mine is DATA_3DR and yours is DATA_3D. Can it be the source?
________
DC MARIJUANA DISPENSARY
DPlot and Programs
Moderator: DPlotAdmin
-
DPlotAdmin

- Posts: 2312
- Joined: Tue Jun 24, 2003 9:34 pm
- Location: Vicksburg, Mississippi
- Contact:
Before looking into it I thought you might have caught me on that one, but no. I changed that example to plot 1000 random points and I get the same results. If you'll send me a screenshot maybe that will shed some light on the problem.
Visualize Your Data
support@dplot.com
support@dplot.com
As you can see, the Y line is off. The Y value is in reality at 6.5, not 4.1. There is an unwanted offset but I don' t find it in the code.

________
Magic Flight Launch Box
________
Magic Flight Launch Box
Last edited by guibson on Fri Feb 11, 2011 10:49 pm, edited 1 time in total.
-
DPlotAdmin
- Posts: 2312
- Joined: Tue Jun 24, 2003 9:34 pm
- Location: Vicksburg, Mississippi
- Contact:
It looks to me like this is just a coordinate mapping problem - it looks like if you shifted everything up such that the constant X line ended at the top of the plot (which I'm guessing is what you intended) then Y would be at or very near 6.5.
How are you drawing that symbol and lines? With Windows API calls as in the example, or with more VB-like calls? My guess, but it's just a guess, is that either 1) the upper left corner of the bitmap isn't in the upper left corner of the picture frame for which you're getting a device context or 2) you're using VB gizmos to draw everything and the coordinates are mapped to your form's window, not the frame for the bitmap.
How are you drawing that symbol and lines? With Windows API calls as in the example, or with more VB-like calls? My guess, but it's just a guess, is that either 1) the upper left corner of the bitmap isn't in the upper left corner of the picture frame for which you're getting a device context or 2) you're using VB gizmos to draw everything and the coordinates are mapped to your form's window, not the frame for the bitmap.
Visualize Your Data
support@dplot.com
support@dplot.com
You're right, if everything are shift, Y axe will be ok. I used the win32 functions includes in the btest7 example to draw the point and lines. I tried to start from scratch and the result is the same. I checked to see if the functions took the wrong upper left corner. It took the good. The translations are made with only the PictureBox coordinates.
Is it possible, in the AngleTransforms or Transform3D functions, there are constants good only in the btest7 example? As I can see, it's like a wrong offset calculation.
________
Jeep Jeepster History
Is it possible, in the AngleTransforms or Transform3D functions, there are constants good only in the btest7 example? As I can see, it's like a wrong offset calculation.
________
Jeep Jeepster History
Last edited by guibson on Fri Feb 11, 2011 10:49 pm, edited 1 time in total.
-
DPlotAdmin
- Posts: 2312
- Joined: Tue Jun 24, 2003 9:34 pm
- Location: Vicksburg, Mississippi
- Contact:
Bah...
To answer your question, if you have
Dim DPM as DPLOT_PLOTMETRICSEX
outside any Sub so that it is global as in the example, then there is nothing in Transform3D or AngleTransforms that is specific to the example. And if you're using 'Option Explicit' you'd get an error if you were not doing this correctly, so I don't think this could be the problem.
The only other thing I can think of is that the lines and symbol are drawn at the correct location and it is the bitmap that is placed incorrectly (or at least not placed as the example expects it to be). When you call DPlot_GetBitmapEx, are you using the size of the PictureBox for the requested size of the bitmap, as in:
And if not, are you centering the bitmap within the PictureBox rather than placing it in the upper left corner? (should be the latter).
To answer your question, if you have
Dim DPM as DPLOT_PLOTMETRICSEX
outside any Sub so that it is global as in the example, then there is nothing in Transform3D or AngleTransforms that is specific to the example. And if you're using 'Option Explicit' you'd get an error if you were not doing this correctly, so I don't think this could be the problem.
The only other thing I can think of is that the lines and symbol are drawn at the correct location and it is the bitmap that is placed incorrectly (or at least not placed as the example expects it to be). When you call DPlot_GetBitmapEx, are you using the size of the PictureBox for the requested size of the bitmap, as in:
Code: Select all
ret = GetClientRect(Picture1.hwnd, rcPic)
.
.
hBitmap = DPlot_GetBitmapEx(DocNum, rcPic.Right - rcPic.Left, rcPic.Bottom - rcPic.Top, DPM)Visualize Your Data
support@dplot.com
support@dplot.com
I did not find the problem anymore but it seems to be in the Stretch array of the DPLOT_PLOTMETRICSEX structure I will find the solution. If I add 2.3 at Stretch(1), the line is ok. But the program give us the possibility of changing values dynamicly, so I have to find an algorythm to retreive the good offset.
________
Honda vt600
________
Honda vt600
Last edited by guibson on Fri Feb 11, 2011 10:49 pm, edited 1 time in total.
Hi,
On some plot, DPLot draw data above the data ask to plot. Example 1: Data above the black line are wrong.

To correct, you did the DPlot_3DBorder function. The result is not always as expected. As you can see in Example 2 (the DPlot_3DBorde is used), the white spaces below the black line need to be fill.

You work hard for me and it is very appreciate. I tried to do my best to correct this problem by myself but it seems that DPlot needs more than a contour. Do you have an idea of the problem?
Thanks a lot!
________
Buy No2 Vaporizer
On some plot, DPLot draw data above the data ask to plot. Example 1: Data above the black line are wrong.
To correct, you did the DPlot_3DBorder function. The result is not always as expected. As you can see in Example 2 (the DPlot_3DBorde is used), the white spaces below the black line need to be fill.
You work hard for me and it is very appreciate. I tried to do my best to correct this problem by myself but it seems that DPlot needs more than a contour. Do you have an idea of the problem?
Thanks a lot!
________
Buy No2 Vaporizer
Last edited by guibson on Fri Feb 11, 2011 10:50 pm, edited 1 time in total.
-
DPlotAdmin
- Posts: 2312
- Joined: Tue Jun 24, 2003 9:34 pm
- Location: Vicksburg, Mississippi
- Contact:
I wondered how long it would be before somebody zinged me on this problem, as I knew it would come up sooner or later. The problem is that the boundary is used to remove triangles from the existing triangulation. What I should instead do is generate a new triangulation that takes the border into account. I tried this once and failed; I'll give it another attempt in the next couple of weeks.
Visualize Your Data
support@dplot.com
support@dplot.com
-
DPlotAdmin
- Posts: 2312
- Joined: Tue Jun 24, 2003 9:34 pm
- Location: Vicksburg, Mississippi
- Contact:
By the way... you should be able to prevent this from happening by adding more control points along any concave edge (assuming that you can do that). The goal is to create a triangular mesh that has no triangles crossing your boundaries.
I still plan to change things so that the mesh is regenerated and takes your boundary into account, but in the meantime the above will work.
I still plan to change things so that the mesh is regenerated and takes your boundary into account, but in the meantime the above will work.
Visualize Your Data
support@dplot.com
support@dplot.com
In the exemple 2, there is 10 times more points added along the edge than the exemple 1!
________
54-DEGREE V6 ENGINE
________
54-DEGREE V6 ENGINE
Last edited by guibson on Fri Feb 11, 2011 10:50 pm, edited 1 time in total.
-
DPlotAdmin
- Posts: 2312
- Joined: Tue Jun 24, 2003 9:34 pm
- Location: Vicksburg, Mississippi
- Contact:
Then perhaps the problem is just a poor selection of border points. If you'll save the plot to a DPlot file and send it to me that would be helpful.
Visualize Your Data
support@dplot.com
support@dplot.com
-
DPlotAdmin
- Posts: 2312
- Joined: Tue Jun 24, 2003 9:34 pm
- Location: Vicksburg, Mississippi
- Contact:
Here's a simple example that I think probably illustrates the problem both of you are having. If this is no help or if you disagree that adding nodes along the desired edge will fix your problem, please save your graph as a DPlot file and send it to me, along with an explanation of where you want the exterior border to be.
The first plot shown below consists of 20 points that are the vertices of 2 concentric star shapes, 10 points each.
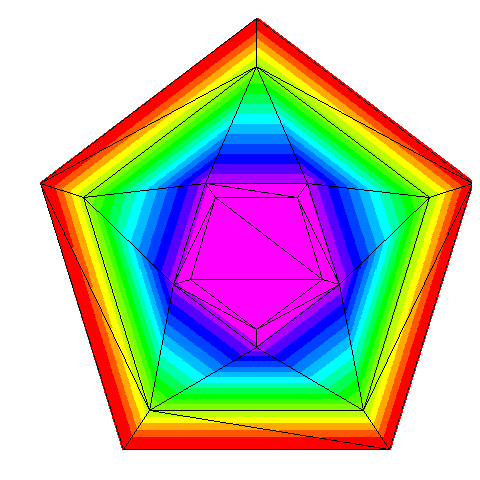
We want the exterior border to be the outer edge of the larger star. So we use "Define Boundary" and pick those points. The picture below shows the same plot with the boundary drawn in reverse video.
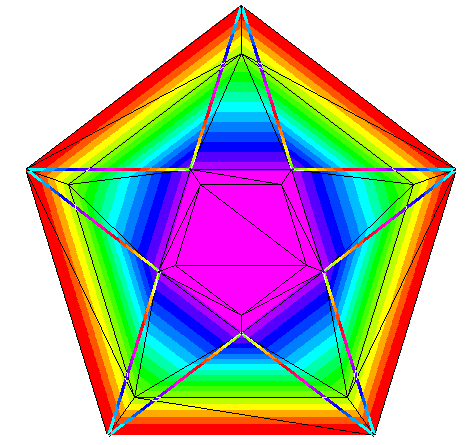
You can see that several triangles cross over the boundary line segments. This creates this plot, which isn't what we intended at all:
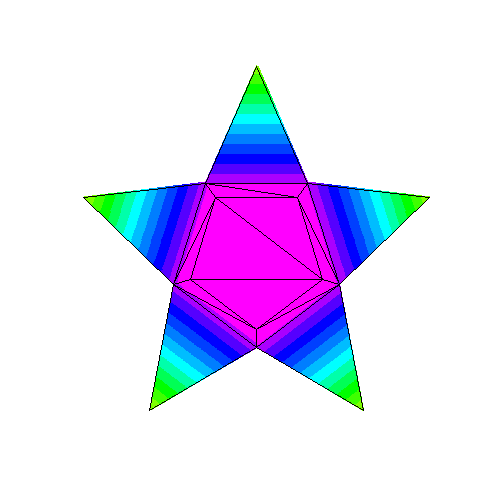
If we go back and add nodes at the midpoints of each outer line segment of our largest star, then the triangulation looks quite a bit different:
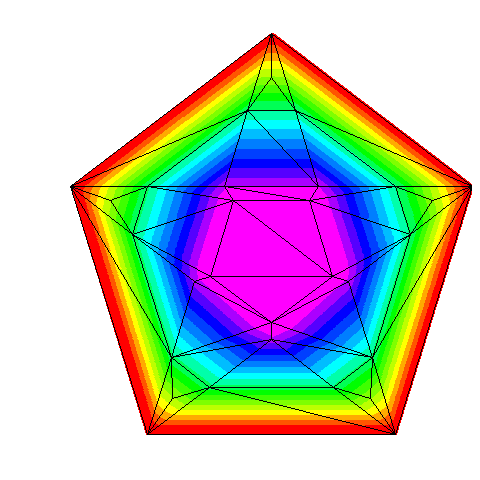
Notice that all triangles are now completely inside or completely outside our desired border. Selecting the same border points as before, we now get:
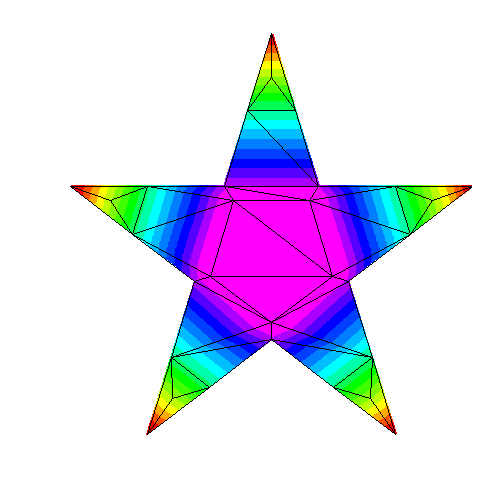
It may be that my earlier statement about reworking things so that a new triangulation that takes the border into account will do the job, but I'm not so sure about that. I think in many cases that to get the border you want, DPlot itself will have to interpolate and add new nodes. I'm not comfortable adding data points to someone else's data when I don't know anything about what the data is meant to represent. The short version is: if you have a concave border then you'll need enough points along that border to influence the triangulation such that no triangles cross the border.
The first plot shown below consists of 20 points that are the vertices of 2 concentric star shapes, 10 points each.
We want the exterior border to be the outer edge of the larger star. So we use "Define Boundary" and pick those points. The picture below shows the same plot with the boundary drawn in reverse video.
You can see that several triangles cross over the boundary line segments. This creates this plot, which isn't what we intended at all:
If we go back and add nodes at the midpoints of each outer line segment of our largest star, then the triangulation looks quite a bit different:
Notice that all triangles are now completely inside or completely outside our desired border. Selecting the same border points as before, we now get:
It may be that my earlier statement about reworking things so that a new triangulation that takes the border into account will do the job, but I'm not so sure about that. I think in many cases that to get the border you want, DPlot itself will have to interpolate and add new nodes. I'm not comfortable adding data points to someone else's data when I don't know anything about what the data is meant to represent. The short version is: if you have a concave border then you'll need enough points along that border to influence the triangulation such that no triangles cross the border.
Visualize Your Data
support@dplot.com
support@dplot.com